Starting from the Live View,
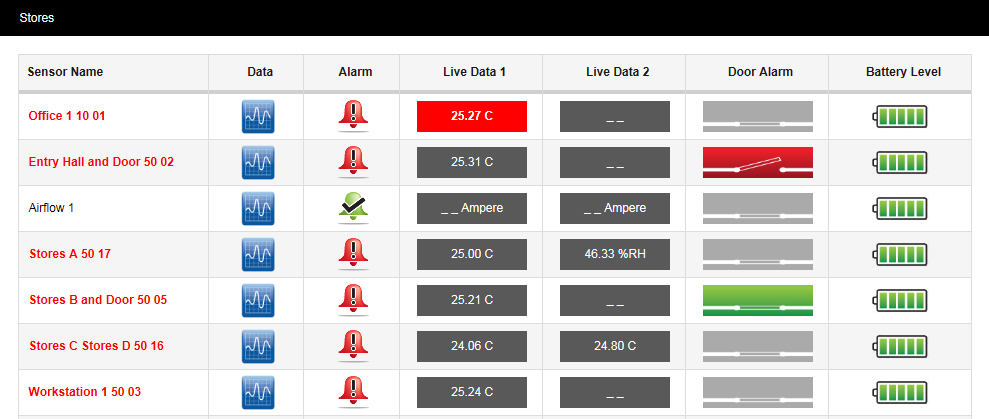
click on ![]() for the sensor of interest to give, for example:
for the sensor of interest to give, for example:
Here, the graph shows live temperature data, starting at 00:00 for the Office 1 10 01 sensor.
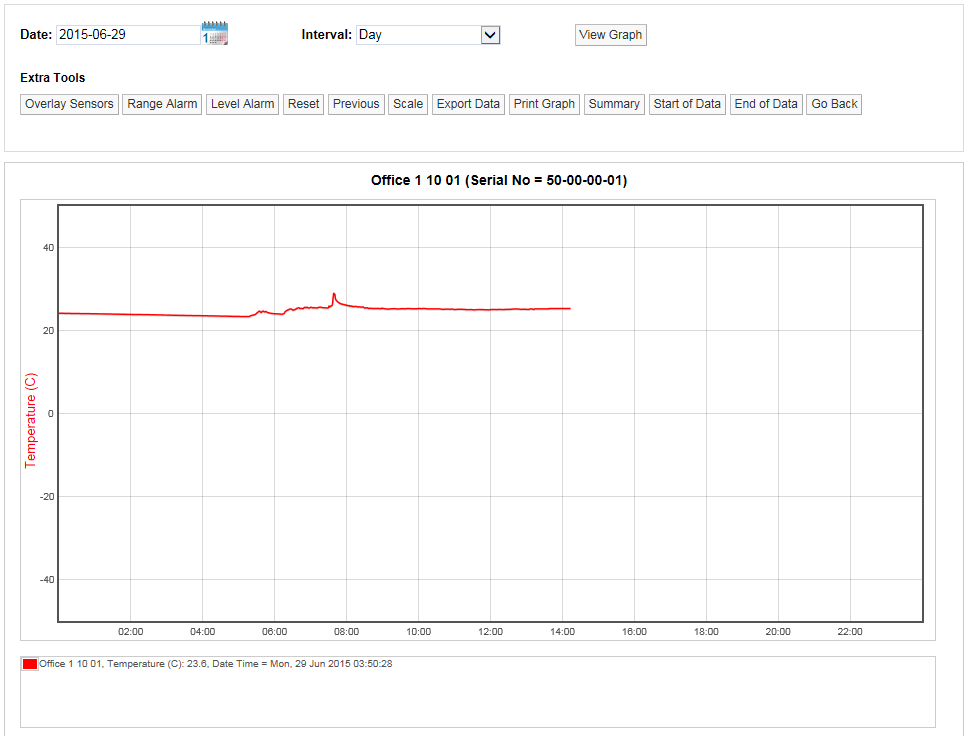
An example of a graph for a two-channel sensor might be as shown below:
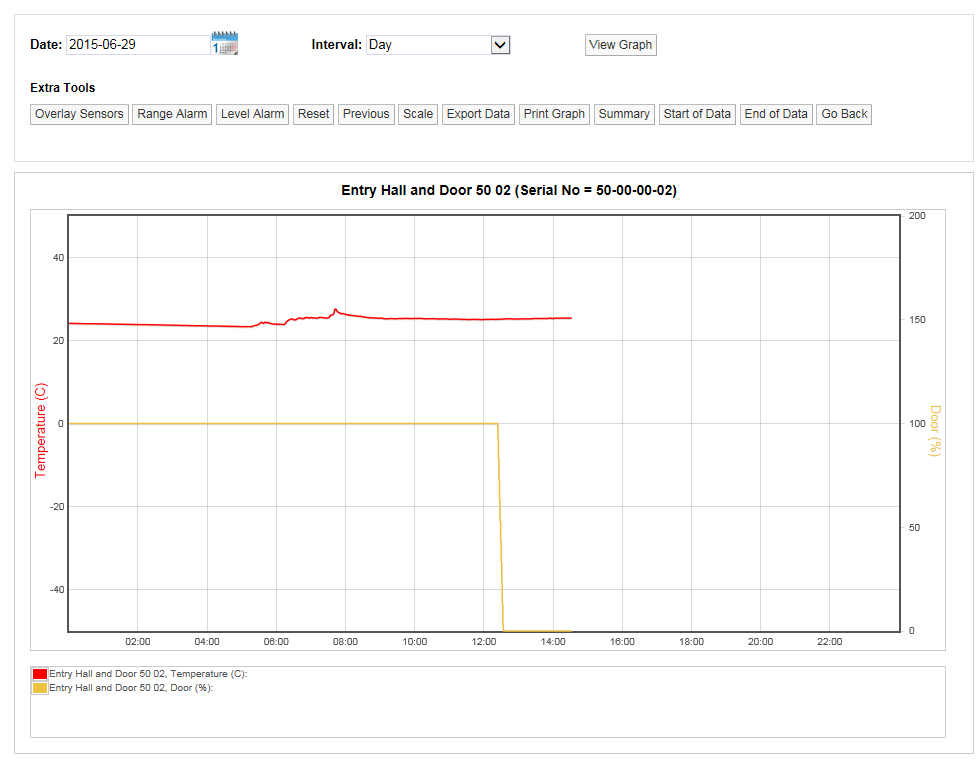
Here we see temperature data in red, door data in yellow. The door had been open (and so in an alarm state) until about 12:30, then somebody closed the door.
See also: