Notion Pro can produce a variety of Reports. These can be tailored to a customer’s individual specifications. The report will be in .pdf format with the option to export a .csv data file.
Your Company Logo can be automatically added to any standard (PDF or RTF) report.
You can create and view:
These can be summaries of data collected by selected sensors or all sensors in a Zone over the past week.
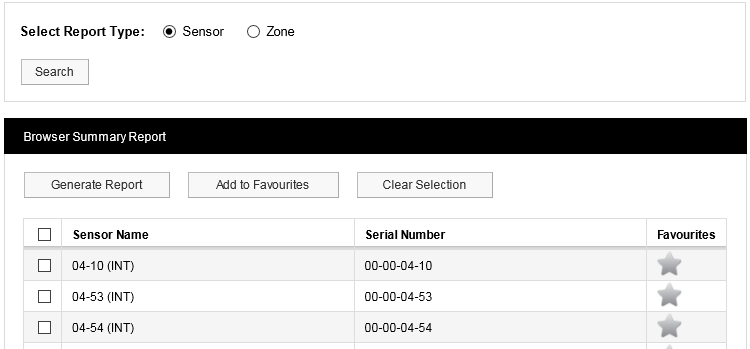
1.Select Reports>Browser Summary Reports to give the Browser Summary Report dialog box:
|
2.To report on selected Sensors: i.Ensure that the Sensor option button is selected. ii.Select the sensors of interest from the Sensor Name list. iii.Select Generate Report. |
3.To report on a Zone: i.Ensure that the Zone option button is selected. ii.Select Search. iii.Select the Zone of interest from the Zone Name list. iv.Select Generate Report. |
See also:
A simple report of all sensors that need calibrating on a given date.
1.Select Reports>Browser Calibration Reports. 2.By default, a Report will be generated for all sensors which need to be calibrated one month from today's date. If you wish to select a different due date click |
1.Select Reports>Browser Exception Reports or Reports>Extended Exception Reports. •To report on selected Sensors: i.Ensure that the Sensor option button is selected. ii.Select the sensors of interest from the Sensor Name list. •To report on a Zone: i.Ensure that the Zone option button is selected. ii.Select Search. iii.Select the Zone of interest from the Zone Name list. 2.Select Generate Report. |
Exception Report - Reports all the sensors which have gone over/under thresholds in selected date/time, by Sensor or by Zone.
Extended Exception Report - Adds User Notes to the Exception Report.
Scheduled Reports cover a variety of Report types, including Summary and Exception reports, which can be set up to start at a pre-defined date/time and can run at pre-defined intervals.
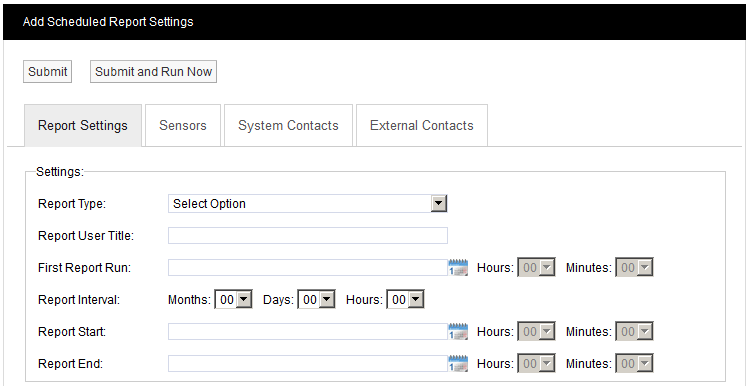
1.Select Reports>Scheduled Reports to give the Add Scheduled Report Settings dialog box:
|
||
2.Select the required Scheduled Report Type from the Report Type: pull-down list in the Report Settings section of the window (see above). 3.Enter a suitable title for the Report in the Report User Title: box. 4.Select a date and time for the first Report run using the First Report Run: controls. This should be later today or any time in the future. 5.Specify a Report Interval if required. This is the length of time between repeated runs of the Report. For example an interval of one day would give daily Reports. You don’t have to specify a Report Interval, this would give a ‘one off’ Report. 6.Use the Report Start: and Report End: controls to specify the time span for the Report. This would typically be dates in the past, but could be dates in the future (although if, for example you specified a start date one week in the future and end date two weeks in the future you would have to wait 2 weeks before you saw a Report).
7.Having set up the Report dates, we now need to specify the Sensor data that we wish to report on. Click the Sensors tab, then click Add Sensors to give the Add Sensors dialog box. 8.Select the Zone that contains the sensors you wish to report on from the Zone Name pull-down list. The Source List becomes populated with the sensors in the selected Zone. 9.Select a sensor in the Source List that you wish to report on, and select 10.When satisfied with your selections, select Submit. 11.Now we need to specify a list of Users (System Contacts) that the Report will be emailed to. Click the System Contacts tab, then click Add Sensors to give the Add Contacts dialog box. 12.Populate the Destination List for System Contacts using the same methods that you used to populate the Destination List for Sensors (see step 9 above). When satisfied with your selections click Submit. 13.If any External Contacts have been set up and you wish to send the Report to them, select the External Contacts tab and populate and Submit it in the same way as for System Contacts. 14.When satisfied with all of your Report Settings, select Submit or Submit and Run Now under the Add Scheduled Report Settings banner. Submit and Run Now button is used to generate reports immediately; however some delay can be expected if a large report is submitted. The Scheduled Report you have defined will now be added to the View Scheduled Reports window. |
Notion Pro can be configured to display your Company's Logo on standard reports, when they are generated by Notion Pro, by using the Notion Pro Configuration Tool as follows:
1.Start the Notion Pro Configuration Tool by selecting it's entry in the Start menu. •A series of windows will be shown as the Notion Pro Configuration Tools load. •The exact windows shown will depend on the OS of the machine Notion Pro is running on; examples are shown below:
2.Click on Yes or OK on the displayed windows to accept each stage of the Notion Pro Configuration Tools start-up. 3.Select Notion Pro Tools from the menu bar on the displayed Notion Pro Ver: X.X.x.x window. See Figure 1 below:
Figure 1
4.Select Images from the drop down menu. See Figure 2 below:
Figure 2
5.Select Load Reports Logo from the displayed sub-menu. •An Open window is displayed from which you can navigate to the location of the required image. See Figure 3 below:
Figure 3
6.Select the required company logo image and click on Open. •The Reports Logo window is displayed with a preview of the selected Company Logo. See Figure 4 below:
Figure 4
7.If the logo is displayed correctly, click on Accept. 8.Click Exit on the Notion Pro Configuration Ver: X.X.x.x window. From this point onwards, your Company's logo will be displayed on all standard reports as they are generated by Synergy. |
See also:
Setting Up and Running Reports